概要图
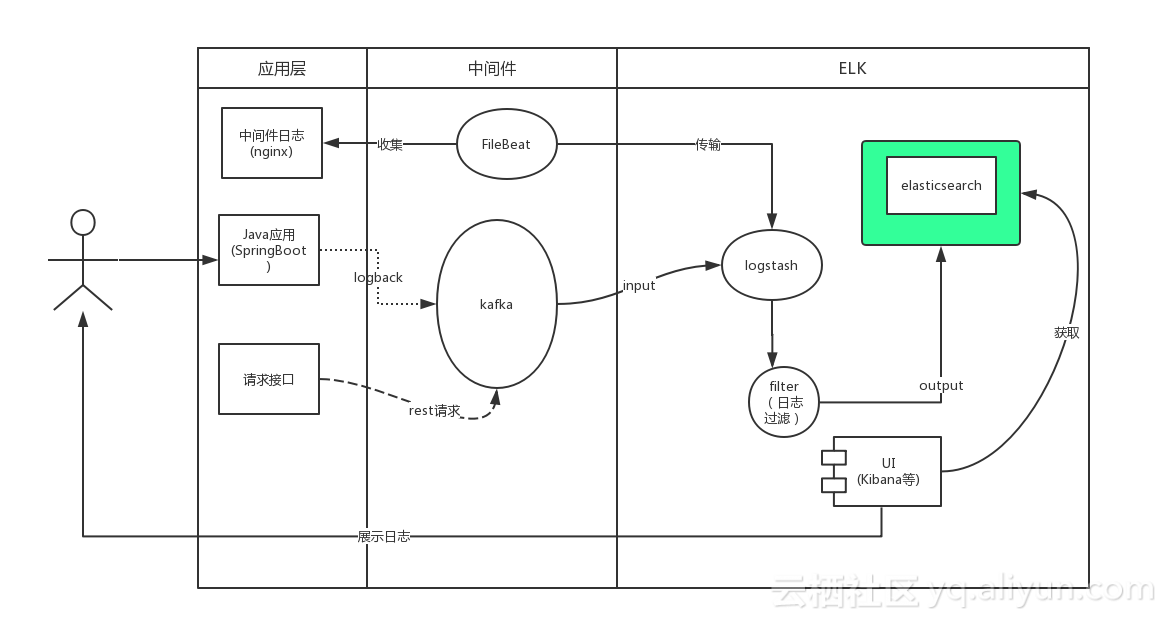
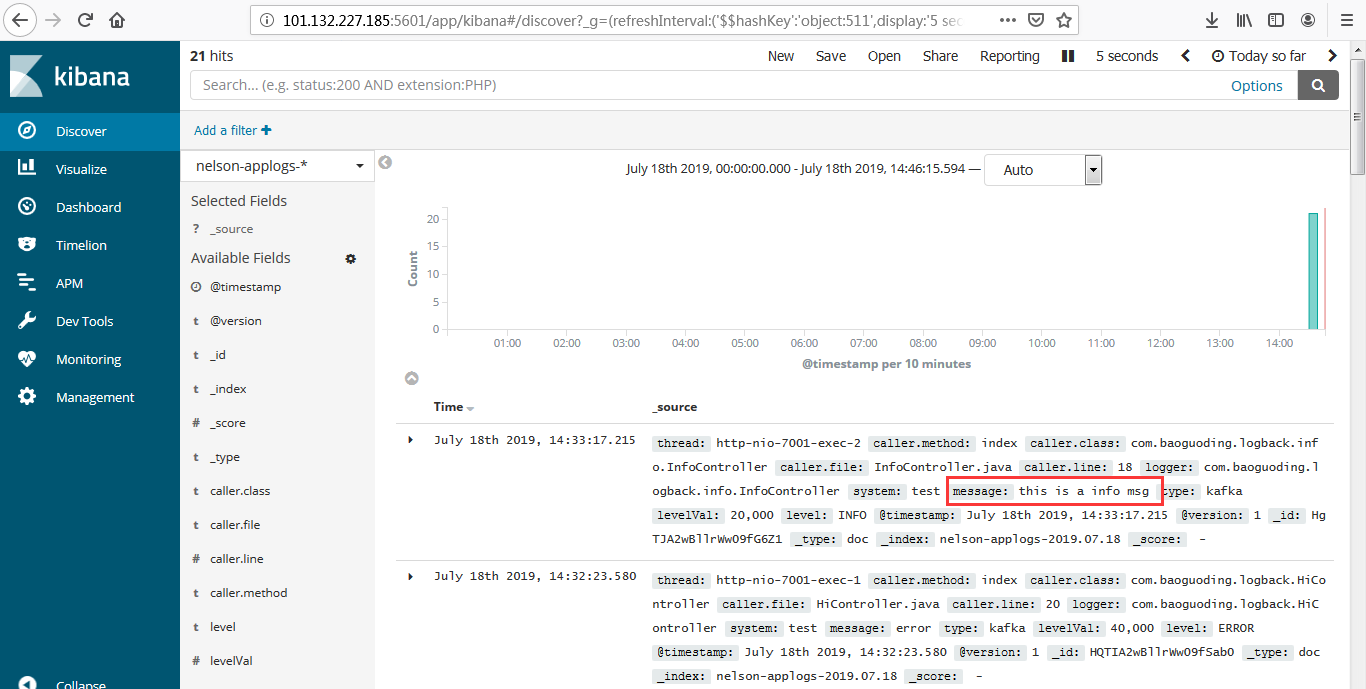
用户通过java应用程序的Slf4j写入日志,SpringBoot默认使用的是logback。我们通过实现自定义的Appender将日志写入kafka,同时logstash通过input插件操作kafka订阅其对应的主题。当有日志输出后被kafka的客户端logstash所收集,经过相关过滤操作后将日志写入Elasticsearch,此时用户可以通过kibana获取elasticsearch中的日志信息
- 我们是通过logback打印日志,然后将日志通过kafka消息队列发送到Logstash,经过处理以后存储到Elasticsearch中,然后通过Kibana图形化界面进行分析和处理。
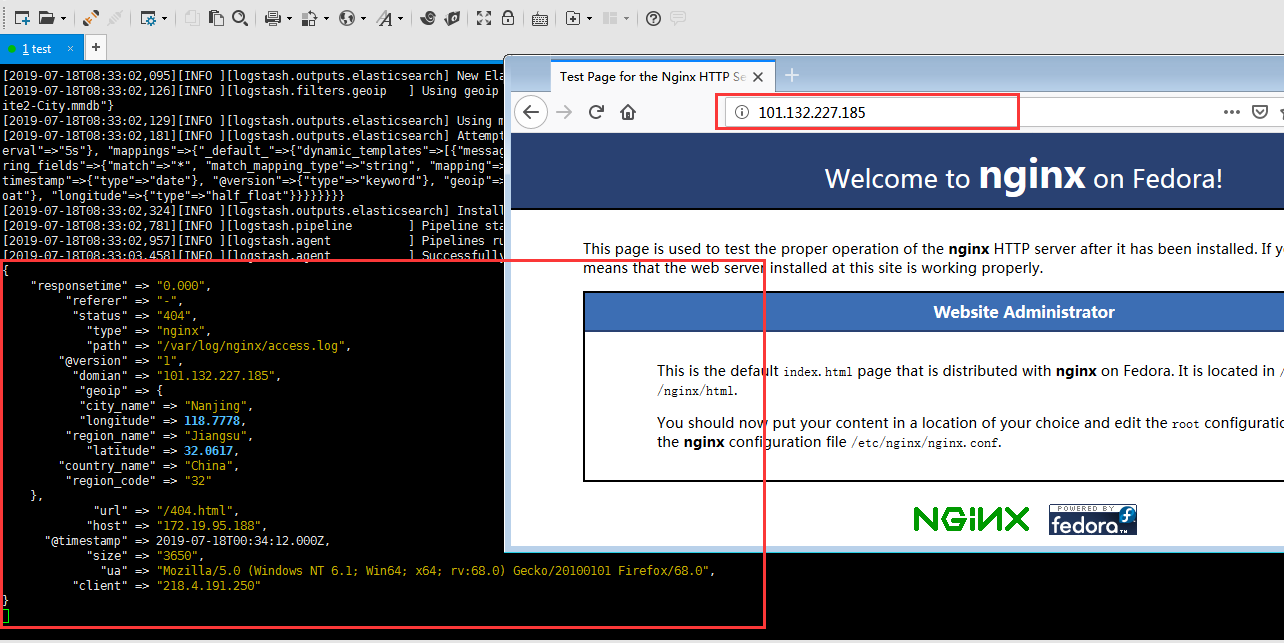
- 我们使用Logstash读取日志文件,经过处理以后存储到Elasticsearch中,然后通过Kibana图形化界面进行分析和处理。例如我们读取nginx的日志文件,可以统计访问用户的ip地域,请求地址等等。
实验环境
- centos 7.2
- elasticsearch / logstash / kibana
- nginx
- kafka
- logback/springboot
- zookeeper
安装配置Java
安装Elasticsearch
1
2
3
4
5
6
7
8
9
10
11
12
13
14
15
16
17
18
19
20
21
adduser elsearch
su elsearch
cd ~
wget https://artifacts.elastic.co/downloads/elasticsearch/elasticsearch-6.3.2.tar.gz
tar -zxvf elasticsearch-6.3.2.tar.gz
cd elasticsearch-6.3.2
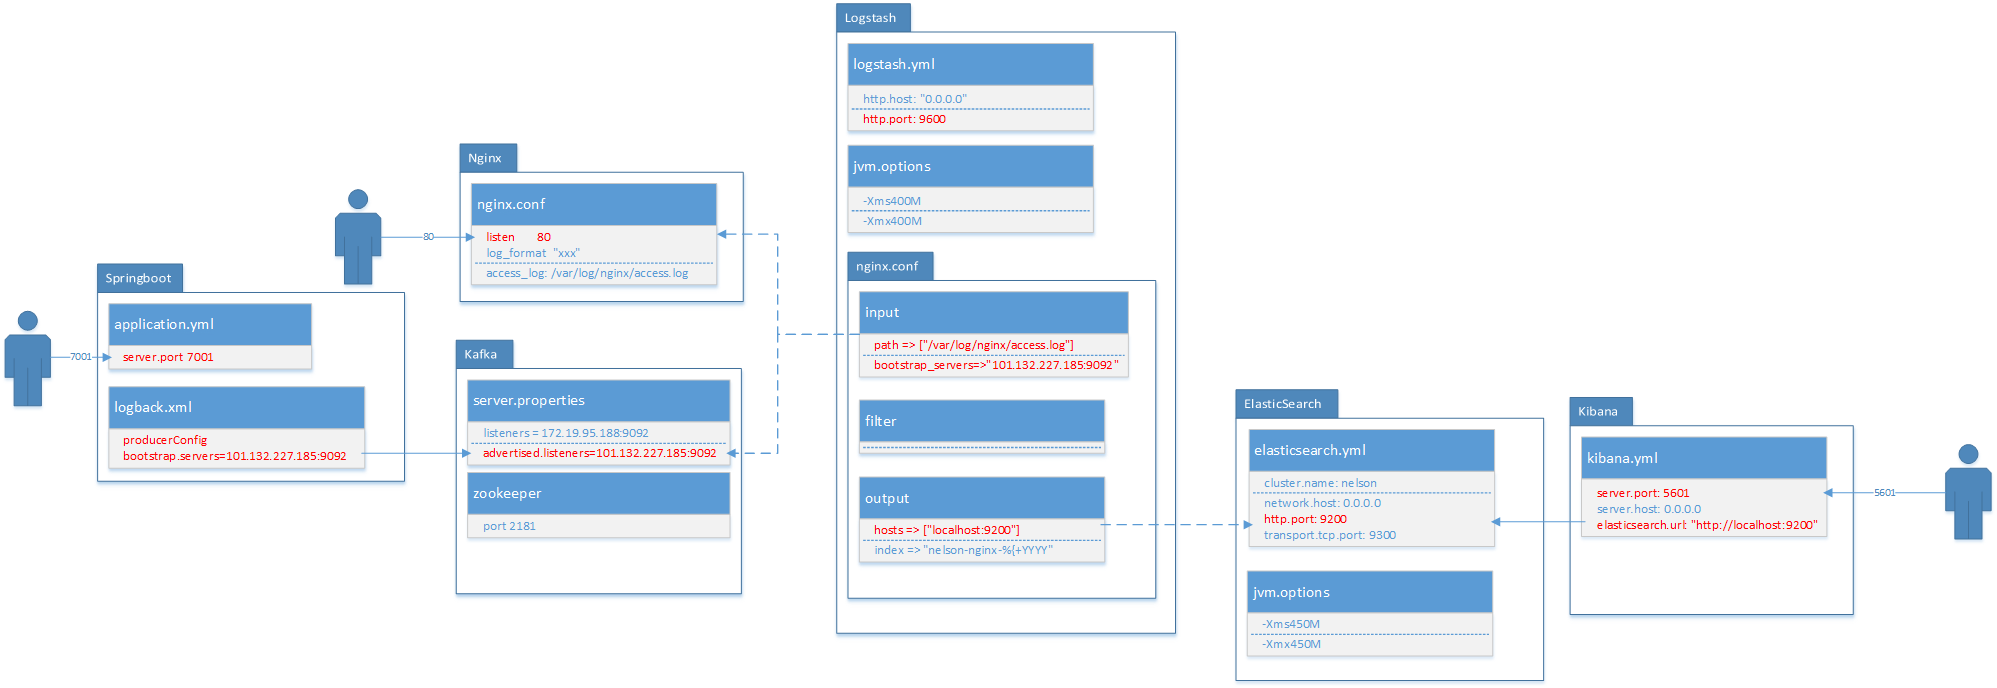
vim config/elasticsearch.yml
#如果配置集群的话,只要name一样就可以自动集群了,不需要单独配置
cluster.name: nelson
network.host: 0.0.0.0 #4个0表示外网可以访问
http.port: 9200 #默认http端口
transport.tcp.port: 9300 #默认tcp端口
vim config/jvm.options
-Xms450M
-Xmx450M
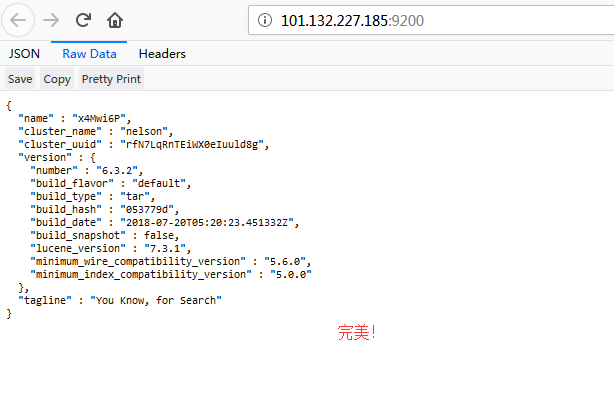
./bin/elasticsearch &
启动过程中,如有错误,百度可以找到解决方案
访问 http://101.132.227.185:9200/
安装Nginx
1
2
yum install -y nginx
vim /etc/nginx/nginx.conf
修改nginx的日志默认输出格式
1
2
3
4
5
6
7
8
9
http {
    log_format  main  '$remote_addr - $remote_user [$time_local] "$request" '
                      '$status $body_bytes_sent "$http_referer" '
                      '"$http_user_agent" "$http_x_forwarded_for"';

    access_log  /var/log/nginx/access.log  main;

    sendfile            on;
改为
1
2
3
4
5
6
7
8
9
10
11
12
13
14
15
16
17
18
http {
    log_format  json '{"@timestamp":"$time_iso8601",'
             '"@version":"1",'
             '"client":"$remote_addr",'
             '"url":"$uri",'
             '"status":"$status",'
             '"domian":"$host",'
             '"host":"$server_addr",'
             '"size":"$body_bytes_sent",'
             '"responsetime":"$request_time",'
             '"referer":"$http_referer",'
             '"ua":"$http_user_agent"'
          '}';

    access_log  /var/log/nginx/access.log  json;

    sendfile            on;
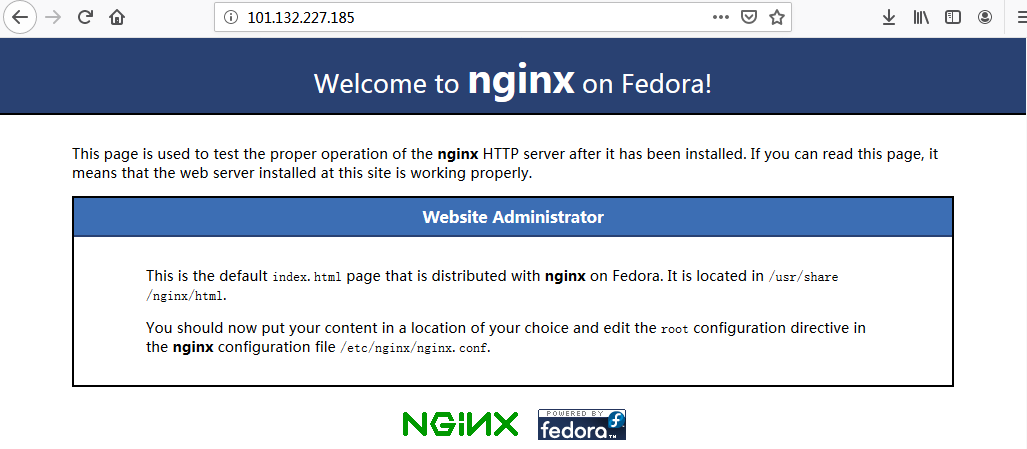
启动nginx服务
1
service nginx start
访问 http://101.132.227.185:80/
安装Logstash
1
2
3
4
5
6
7
8
9
10
11
12
13
cd /usr/local/
wget https://artifacts.elastic.co/downloads/logstash/logstash-6.3.2.tar.gz
tar -zxvf logstash-6.3.2.tar.gz

vim config/logstash.yml

http.host: "0.0.0.0" # 确保外网也可以访问
http.port: 9600

vim config/jvm.options

-Xms400M
-Xmx400M
配置输入输出
在config目录下新建文件nginx.conf
- input表示输入源,他这里有好多插件,支持很多数据源包括文件,http等,我们这里首先收集nginx的日志。file表示读取文件;codec表示读取的文件格式,因为我们前边配置了nginx的日志格式为json,所以这里是json;start_position表示从那一行读取,他会记录上一次读取到那个位置,所以就不用担心遗漏日志了。type相当于一个tag一样,可能这里有很多输入源,后面会根据这个type进行过滤。
- filter表示处理输入数据,因为我们前边配置了nginx的日志里边记录了用户的ip,所以我们使用geoip组件,可以根据ip匹配位置信息,下面表示你将使用那些fields字段;source表示输入json的那个属性。
- output表示输出到哪里,可以文件、redis等,这里我们保存到es里。利用elasticsearch插件,然后配置一下es的地址,索引我们是通过日期自动生成,表示每天创建一个索引
1
2
3
4
5
6
7
8
9
10
11
12
13
14
15
16
17
18
19
20
21
22
23
24
25
input {
file {
path => ["/var/log/nginx/access.log"]
type => "nginx"
codec => "json"
start_position => "beginning"
}
}
filter {
geoip {
fields => ["city_name", "country_name", "latitude", "longitude", "region_name","region_code"]
source => "client"
}
}
output {
if [type] == "nginx" {
elasticsearch {
hosts => ["localhost:9200"]
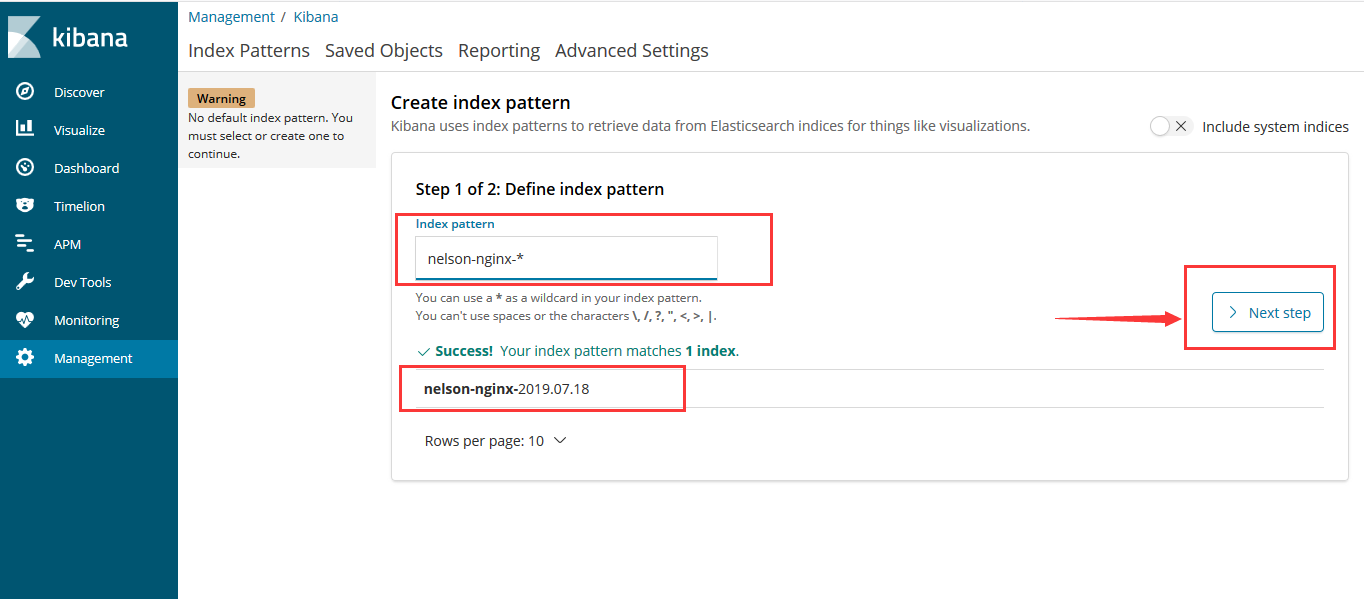
index => "nelson-nginx-%{+YYYY.MM.dd}"
}
stdout {}
}
}
启动
1
./bin/logstash -f ./config/nginx.conf
安装Kibana
1
2
3
cd /usr/local/
wget https://artifacts.elastic.co/downloads/kibana/kibana-6.3.2-linux-x86_64.tar.gz
tar -zxvf kibana-6.3.2-linux-x86_64.tar.gz
修改配置
1
2
3
4
5
6

server.host: 0.0.0.0

elasticsearch.url: "http://localhost:9200"
//我的配置
//elasticsearch.url: "http://101.132.227.185:9200"
启动
1
./bin/kibana &
访问
1
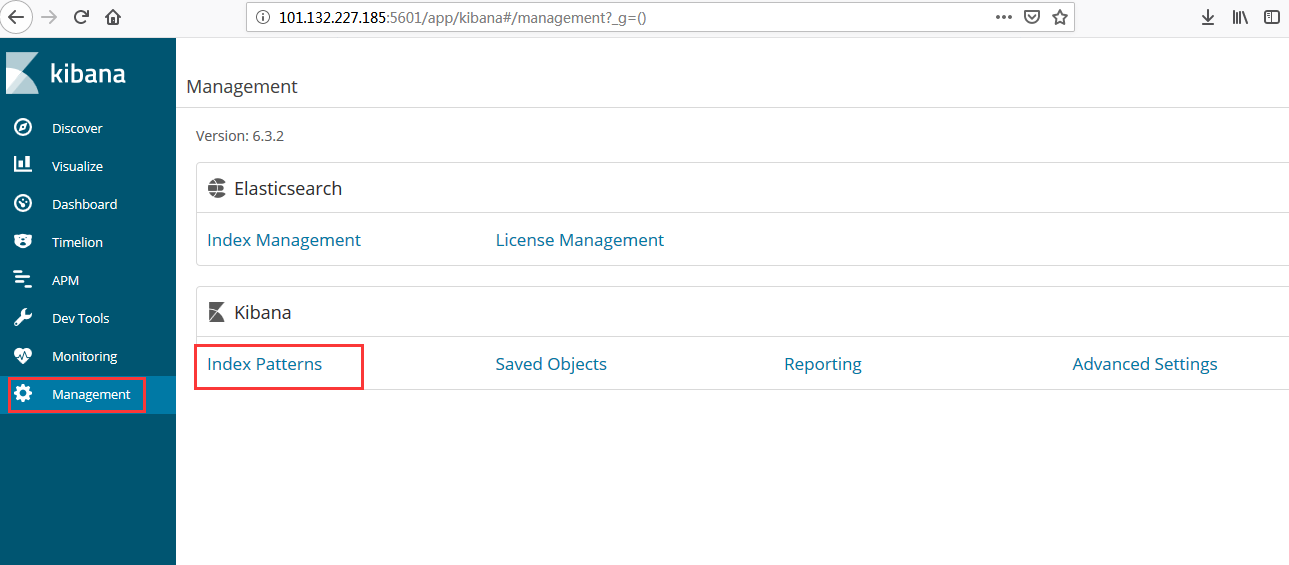
http://101.132.227.185:5601
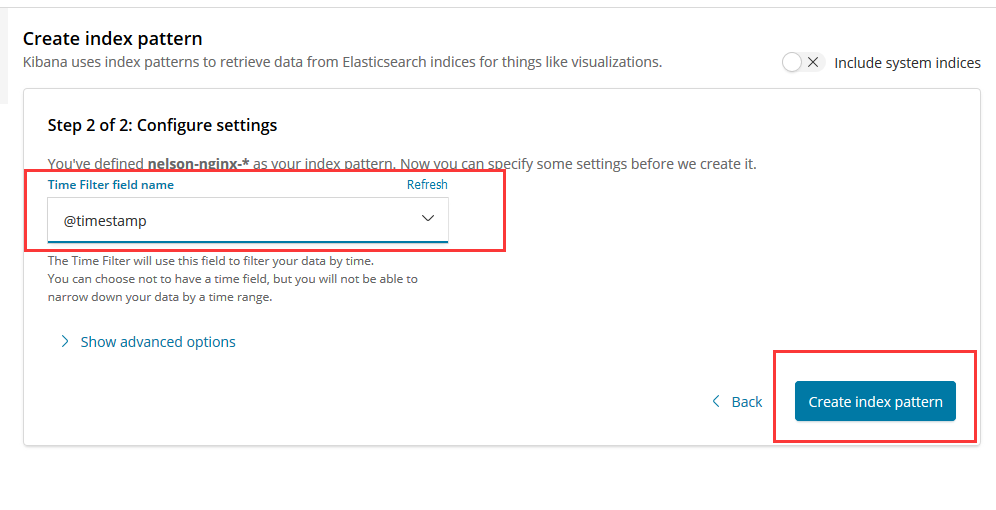
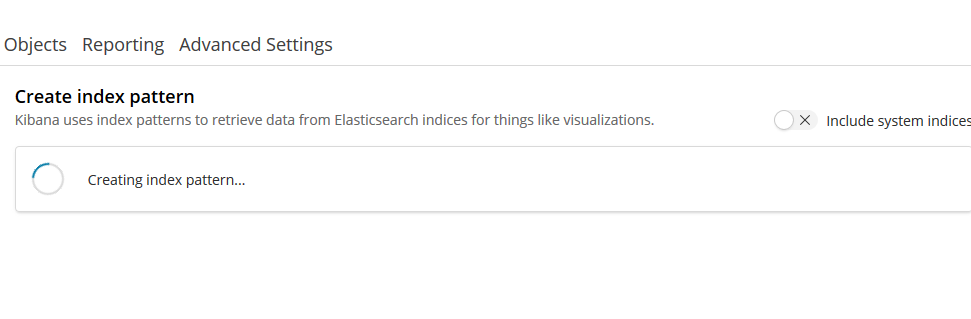
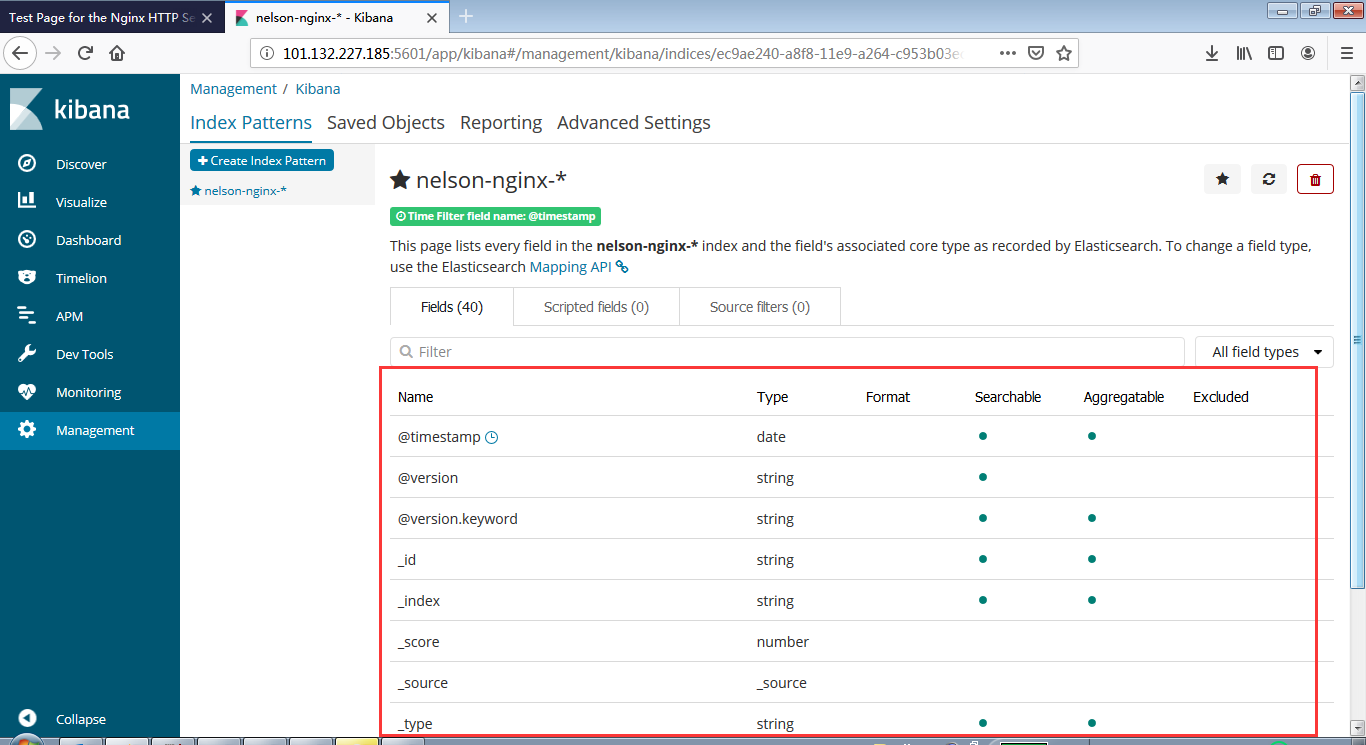
- Index Patterns
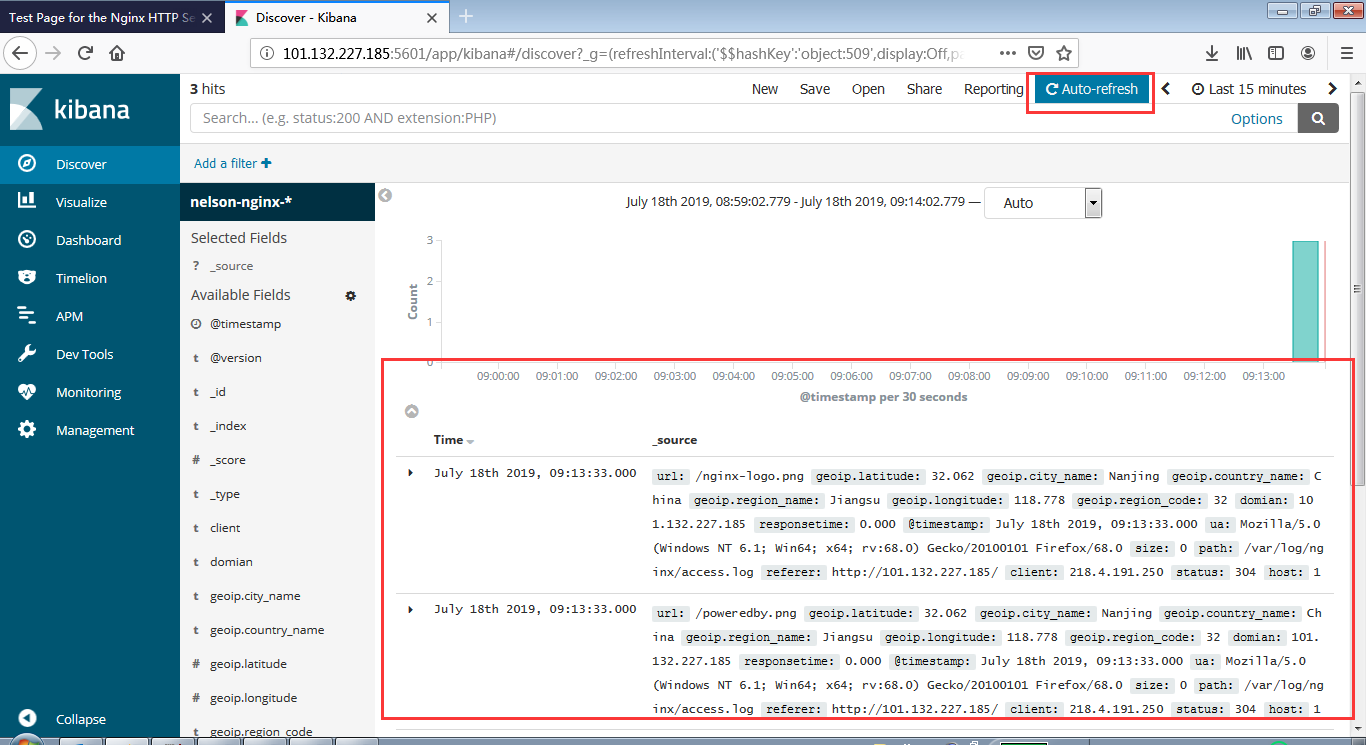
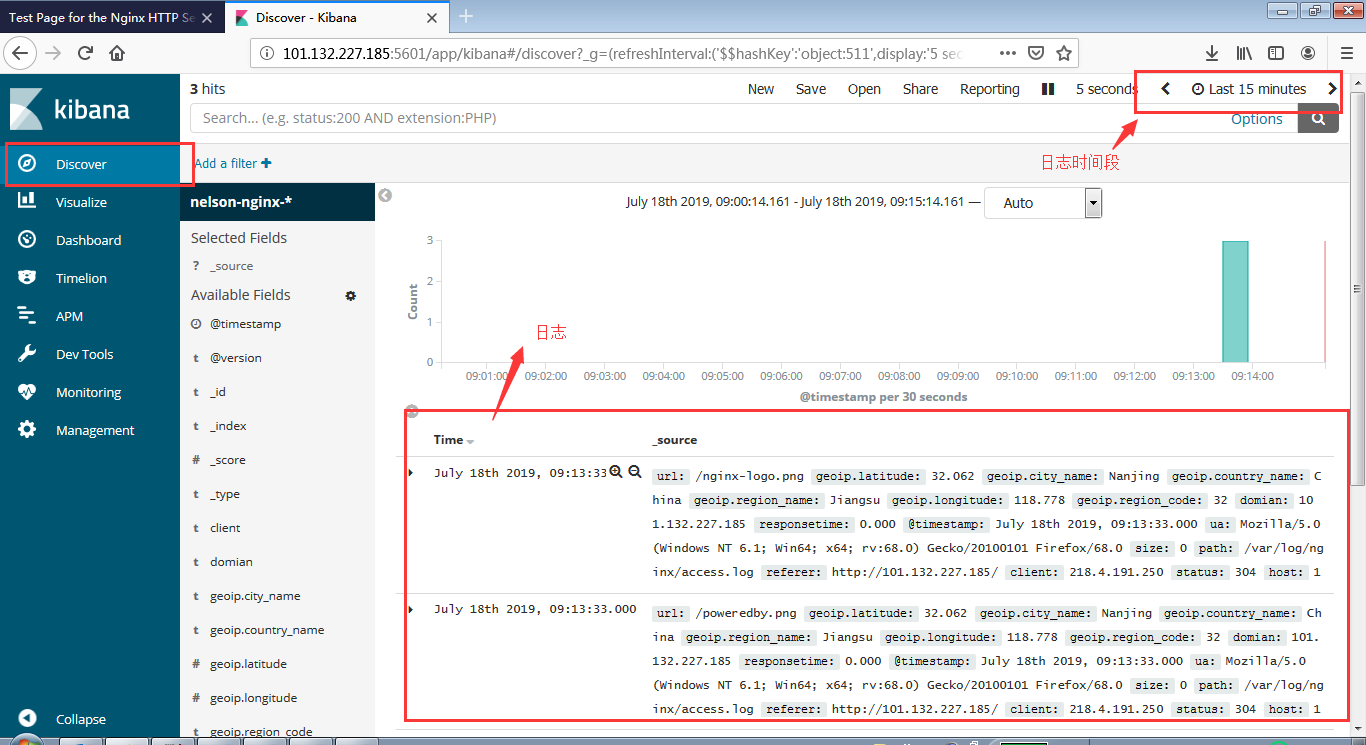
- Discover
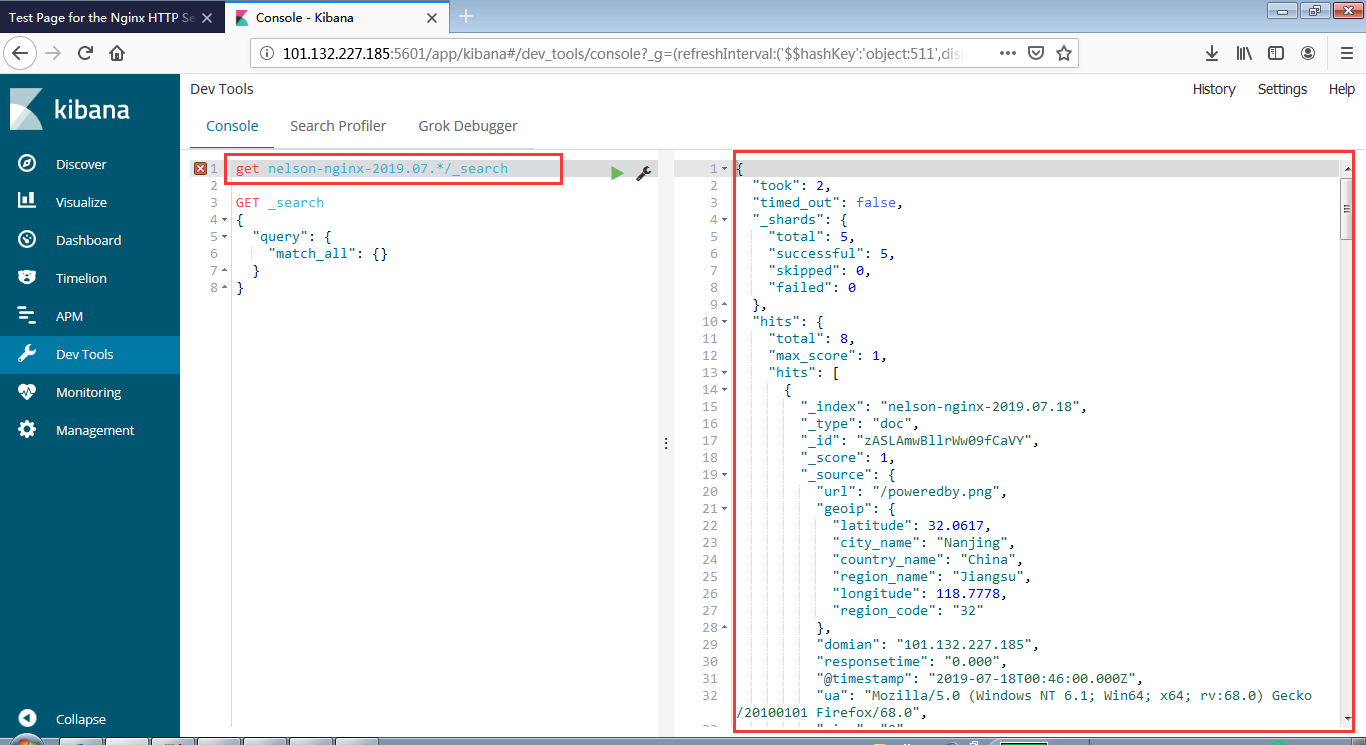
- Dev Tools
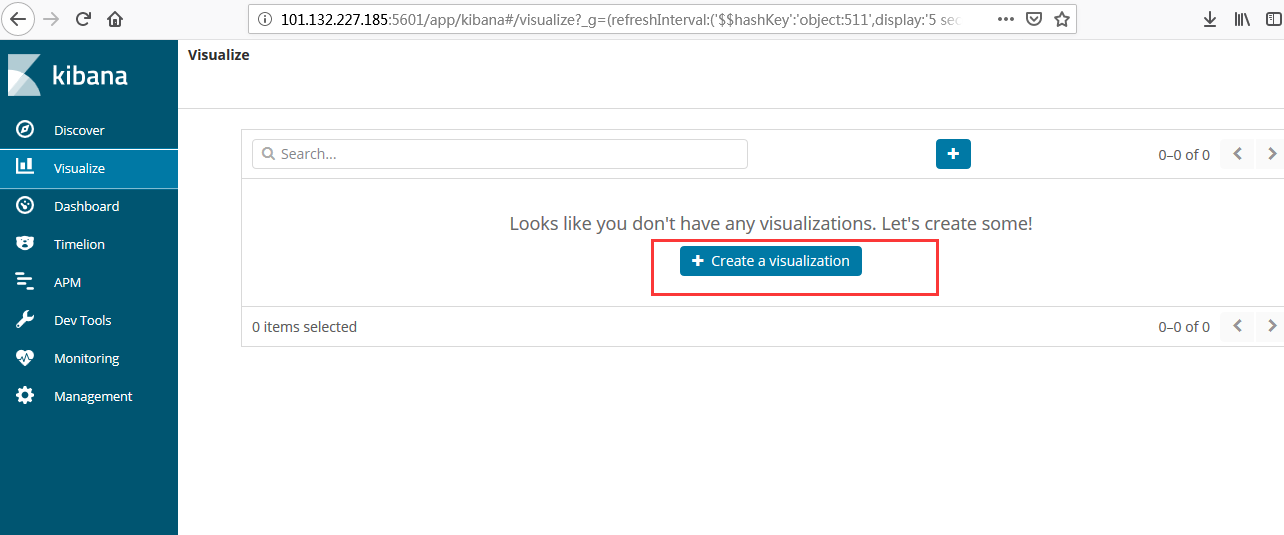
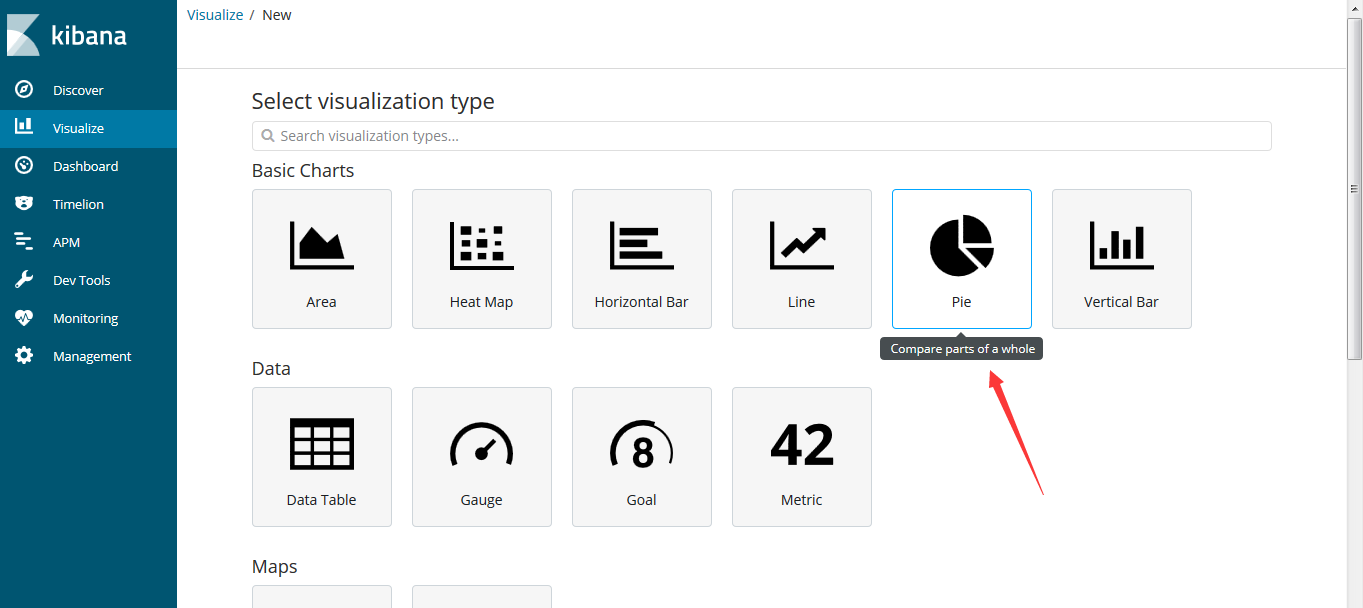
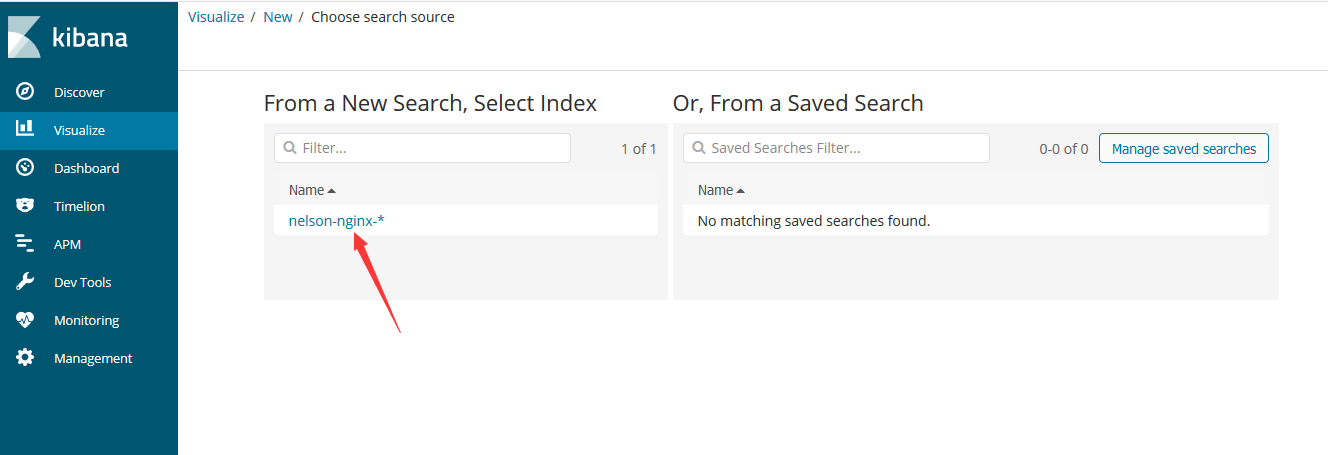
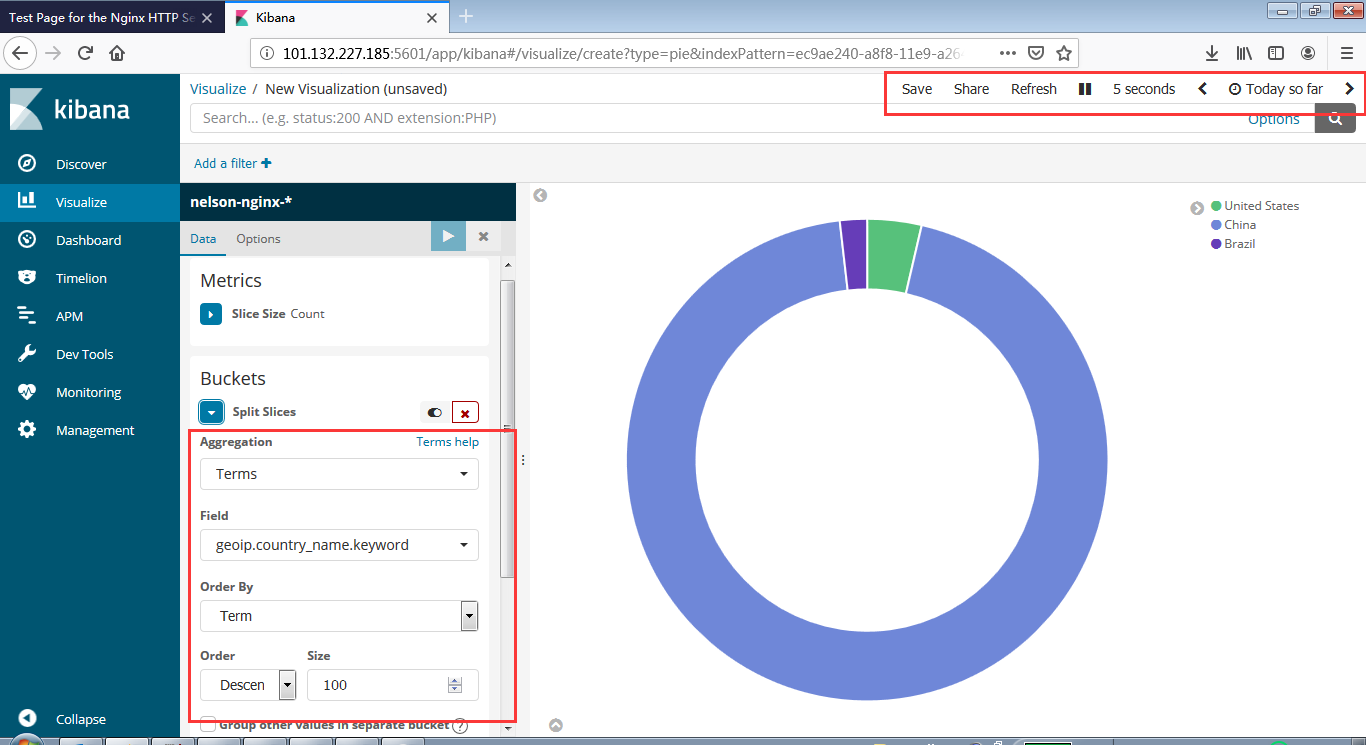
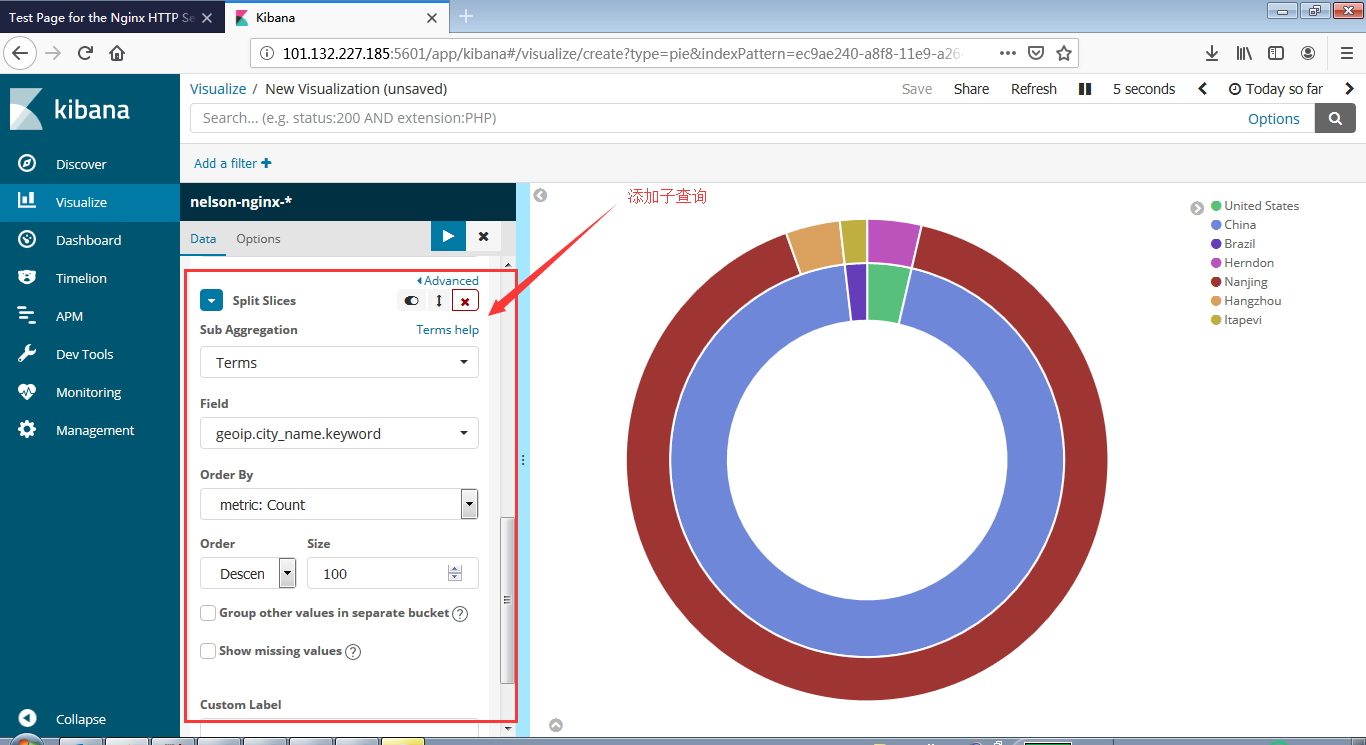
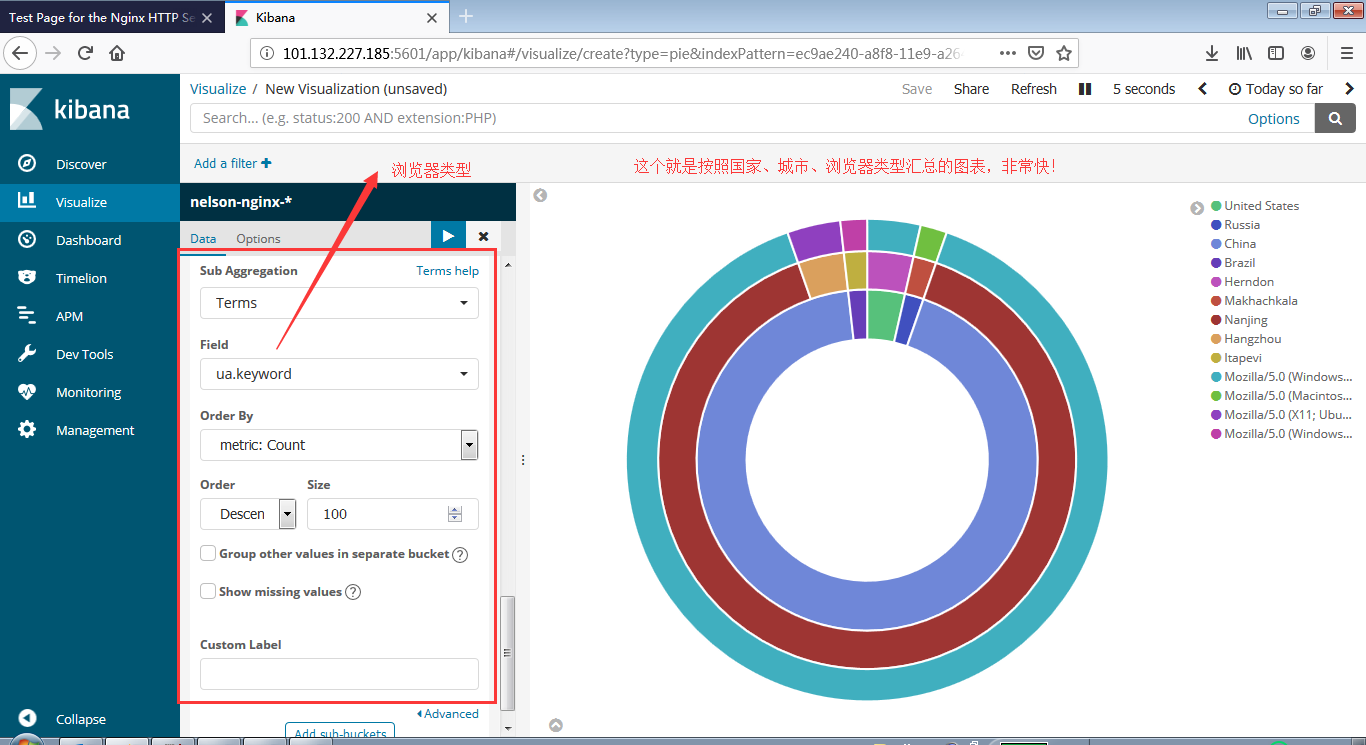
- Visualize
安装Zookeeper
1
2
3
4
5
6
7
wget http://mirrors.hust.edu.cn/apache/zookeeper/zookeeper-3.4.12/zookeeper-3.4.12.tar.gz
tar -zxvf zookeeper-3.4.12.tar.gz
#复制配置
cp zoo_sample.cfg zoo.cfg
修改配置
vi zoo.cfg
dataDir=/root/zk/data #改为你zk目录/data
- 启动
1
./bin/zkServer.sh start
安装Kafka
1
2
3
4
5
6
7
wget https://archive.apache.org/dist/kafka/2.0.0/kafka_2.12-2.0.0.tgz
tar -zxvf kafka_2.12-2.0.0.tgz
cd  kafka_2.12-2.0.0
vim config/server.properties

listeners = PLAINTEXT://172.19.95.188:9092  #阿里云内网地址
advertised.listeners=PLAINTEXT://101.132.227.185:9092  #阿里云外网地址
启动
1
bin/kafka-server-start.sh config/server.properties
1
2
3
4
5
6
7
8
9
10
11
12
13
14
15
16
17
# 创建一个 名称为applog 的topic
bin/kafka-topics.sh --create --zookeeper localhost:2181 --replication-factor 1 --partitions 1 --topic applog

# 查看所有topic
bin/kafka-topics.sh --list --zookeeper localhost:2181

# 消息的生产者,启动以后,在控制台输入信息,然后回车发送
# 指定了地址之后,localhost可能不适用
bin/kafka-console-producer.sh --broker-list localhost:9092 --topic applog
bin/kafka-console-producer.sh --broker-list 172.19.95.188:9092 --topic applog
bin/kafka-console-producer.sh --broker-list 101.132.227.185:9092 --topic applog

# 消息的消费者,如果生产者那里给applog这个top输入信息发送,消费者这边就会在收到,然后在控制台打印出来。
# 指定了地址之后,localhost可能不适用
bin/kafka-console-consumer.sh --bootstrap-server localhost:9092 --topic applog --from-beginning
bin/kafka-console-consumer.sh --bootstrap-server 172.19.95.188:9092 --topic applog --from-beginning
bin/kafka-console-consumer.sh --bootstrap-server 101.132.227.185:9092 --topic applog --from-beginning
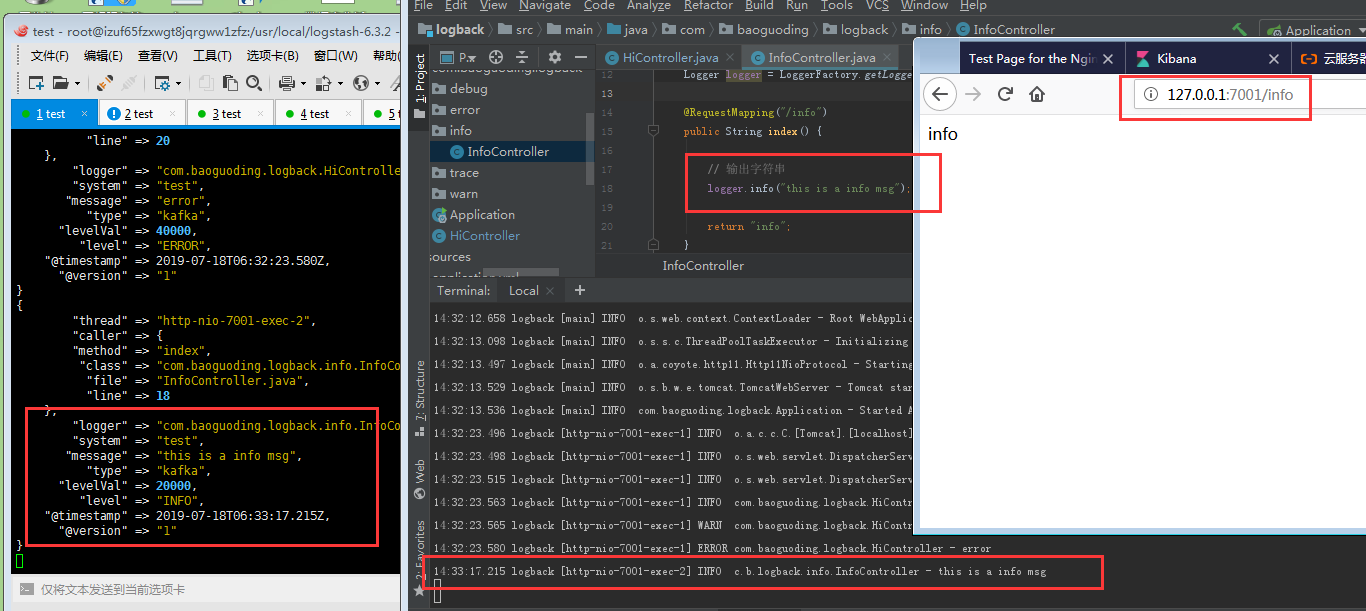
程序中使用logback
修改logbstash的config目录吓得nginx.conf
1
2
3
4
5
6
7
8
9
10
11
12
13
14
15
16
17
18
19
20
21
22
23
24
25
26
27
28
29
30
31
32
33
34
35
36
37
38
39
40
41
42
43
input {
    #nginx日志的输入
    file {
        path => "/opt/access.log"
        type => "nginx"
        codec => "json"
        start_position => "beginning"
    }
    #kafka日志输入
     kafka {
        topics => "applog"
        type => "kafka"
        bootstrap_servers => "101.132.227.185:9092"
        codec => "json"
    }
}

filter {
    if [type] == "nginx" {
         geoip {
                fields => ["city_name", "country_name", "latitude", "longitude", "region_name","region_code"]
                source => "client"
         }
    }
}

output {
    #都输出到es中,但是索引不一样
    if [type] == "nginx" {
        elasticsearch {
            hosts => ["127.0.0.1:9200"]
            index => "nelson-nginx-%{+YYYY.MM.dd}"
        }
        stdout {}
    }
    if [type] == "kafka" {
        elasticsearch {
            hosts => ["127.0.0.1:9200"]
            index => "nelson-applogs-%{+YYYY.MM.dd}"
        }
        stdout {}
    }
}
- 重新启动logstash
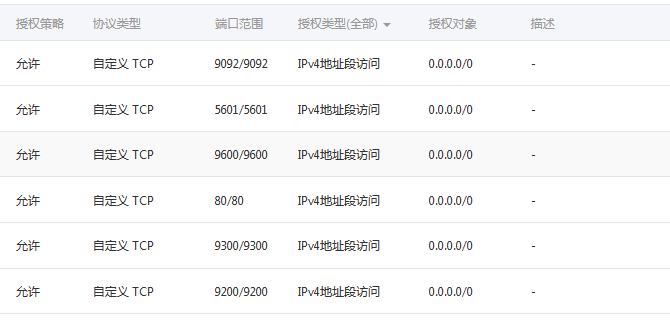
阿里云网络端口配置
本篇文章就结束了,elk+nginx 和 elk+logback+kafka都已经实现了
—————— 报错如下: ERROR: [2] bootstrap checks failed [1]: max file descriptors [65535] for elasticsearch process is too low, increase to at least [65536] [2]: max virtual memory areas vm.max_map_count [65530] is too low, increase to at least [262144] ————— 解决办法: sudo vi /etc/sysctl.conf
添加下面配置:
1
vm.max_map_count=655360 【修该项即可】
并执行命令:
sysctl -p
然后,重新启动elasticsearch,即可启动成功。
sudo vi /etc/security/limits.conf
添加如下内容:
1
2
3
4
* soft nofile 65536 #【修改该项即可】
* hard nofile 131072
* soft nproc 2048
* hard nproc 4096
需要系统重启。 ——————- elasticSearch启用匿名登录。直接在config/elasticsearch.conf添加该行即可。 xpack.security.enabled: false ####开启用户认证 ——————– elasticSearch数据持久化,默认情况不启用数据保存,故数据一般会几分钟就消失,按以下步骤保存索引数据。
1
2
3
4
5
6
7
8
#不同的集群名字不能相同。
cluster.name: es_vm_test
node.name: vmmaster、
#数据索引保存
path.data: /home/abc/elk-5.5.1/elkdata/data
path.logs: /home/abc/elk-5.5.1/elkdata/log
#关闭登录验证
xpack.security.enabled: false
参考
- ELK+logback+kafka+nginx 搭建分布式日志分析平台
- 搭建elasticsearch中遇到的一些问题记录
- ELK解析nginx日志
- Logstash 收集 Nginx 访问日志
- ELK中的logstash启动后无输出
- logstash-best-practice-cn
- Logstash读取不到文件!填坑
参考2
- SpringBoot+kafka+ELK分布式日志收集
- SpringBoot开发案例构建分布式日志处理系统
- Kafka 和 DistributedLog 技术对比
- Spring Boot集成Kafka
- Spring Boot使用Logback通过Kafka实现日志收集
- Logback Kafka Appender Example
- Kafka在SpringBoot 2.0中的整合
- Spring for Apache Kafka